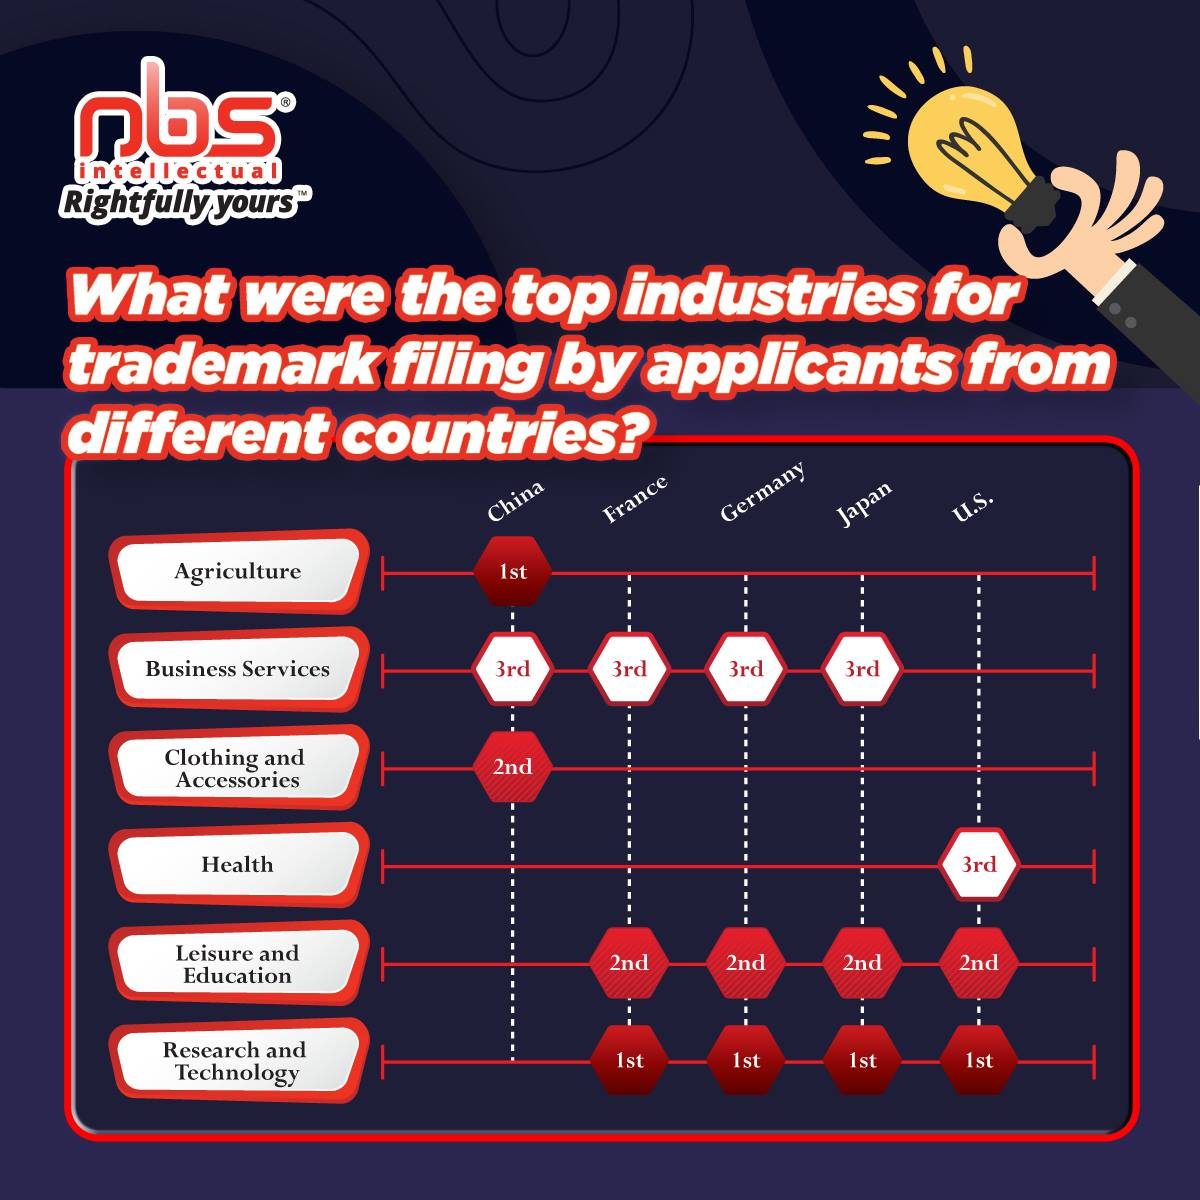
Using the Nice Classification, trademark applications can be attributed to 10 industry sectors. The chart above shows the top three industry sectors for each of the five origins with the highest trademark filing activity in 2018. Research and technology, and leisure and education feature as the two
Year: 2020 (page 42 of 93)
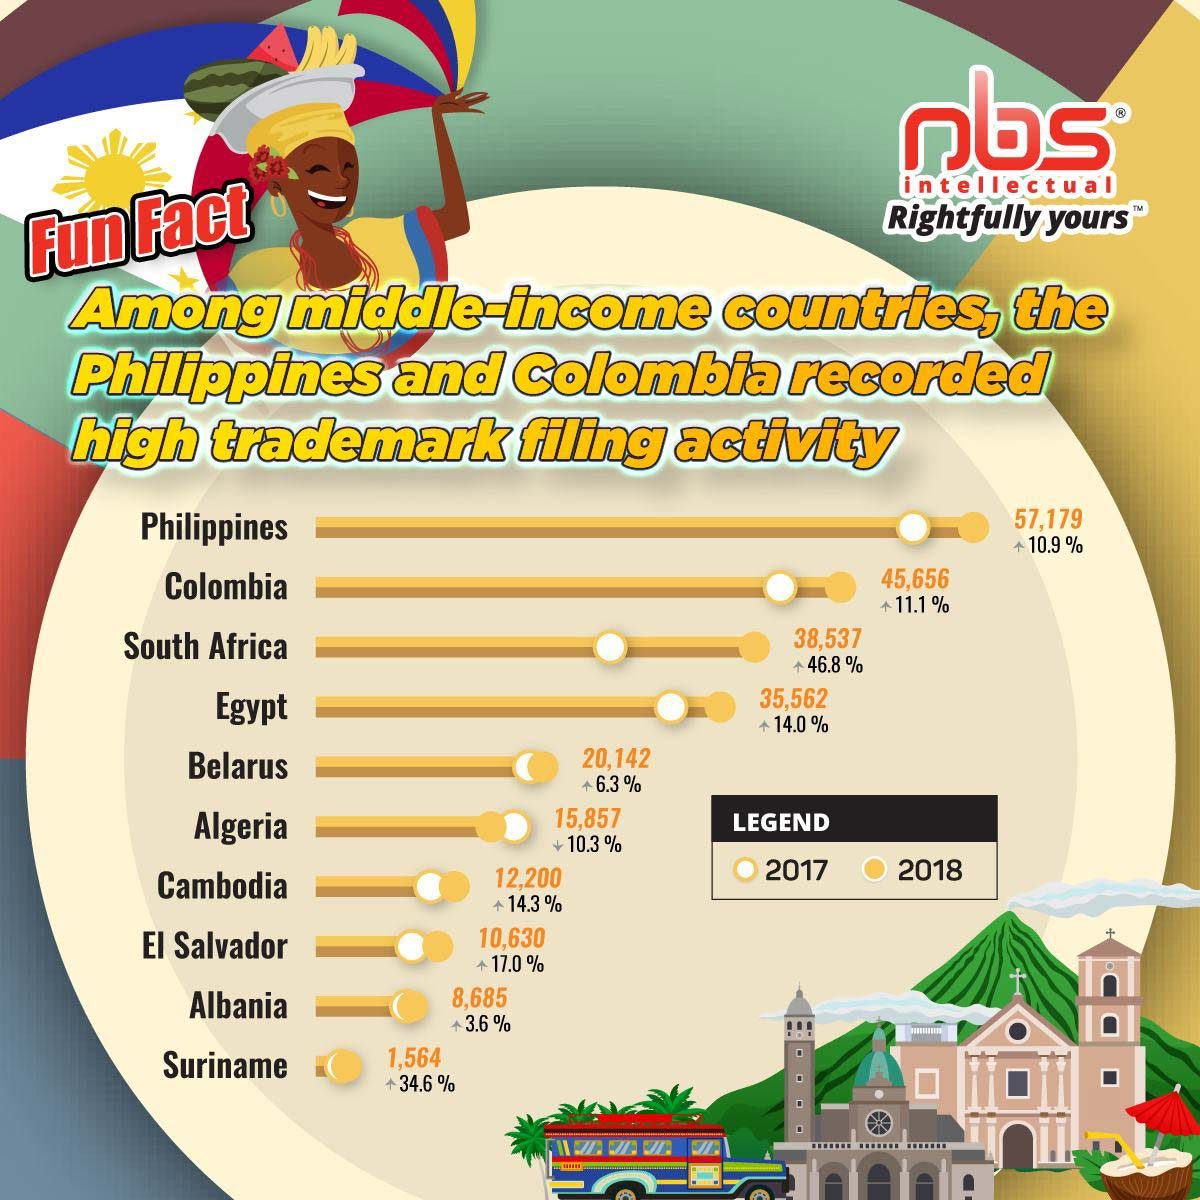
The Philippines (57,179) and Colombia (45,656) had higher trademark filing activity – as measured in class counts – than many other middle-income countries. The chart above shows the total number of classes specified in trademark applications received by the IP offices of a selection of middle-income
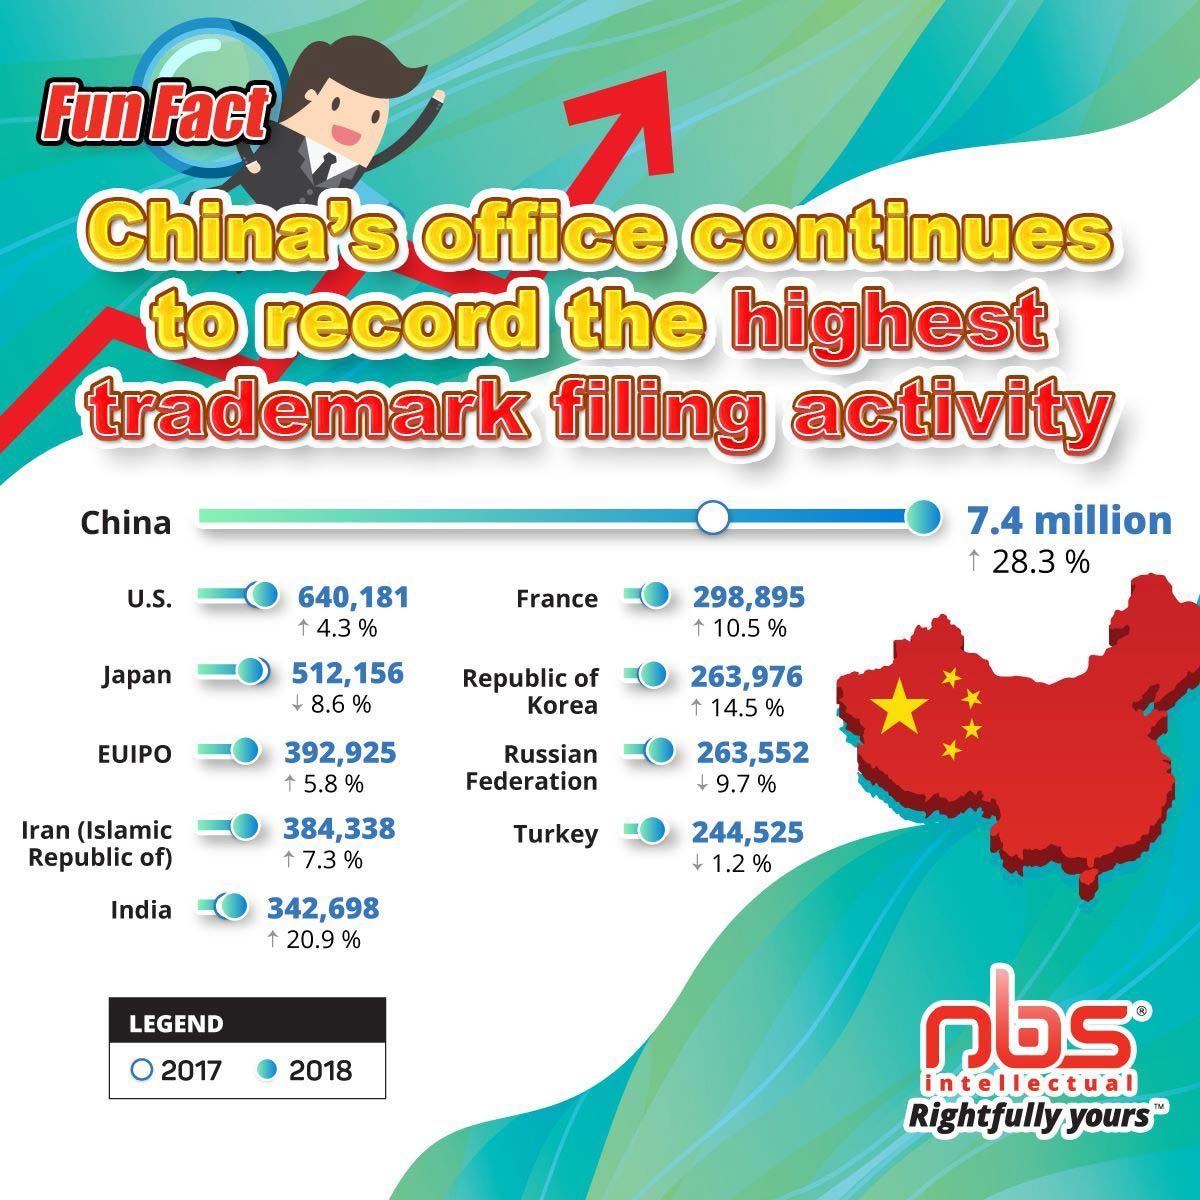
The office of China’s class count of almost 7.4 million ranked first followed by a count of 640,181 at the office of the U.S. These have been the top two offices since the early 2000s, but from 2007 onwards China’s class count has grown from almost twice that of the U.S. to over 11 times as many
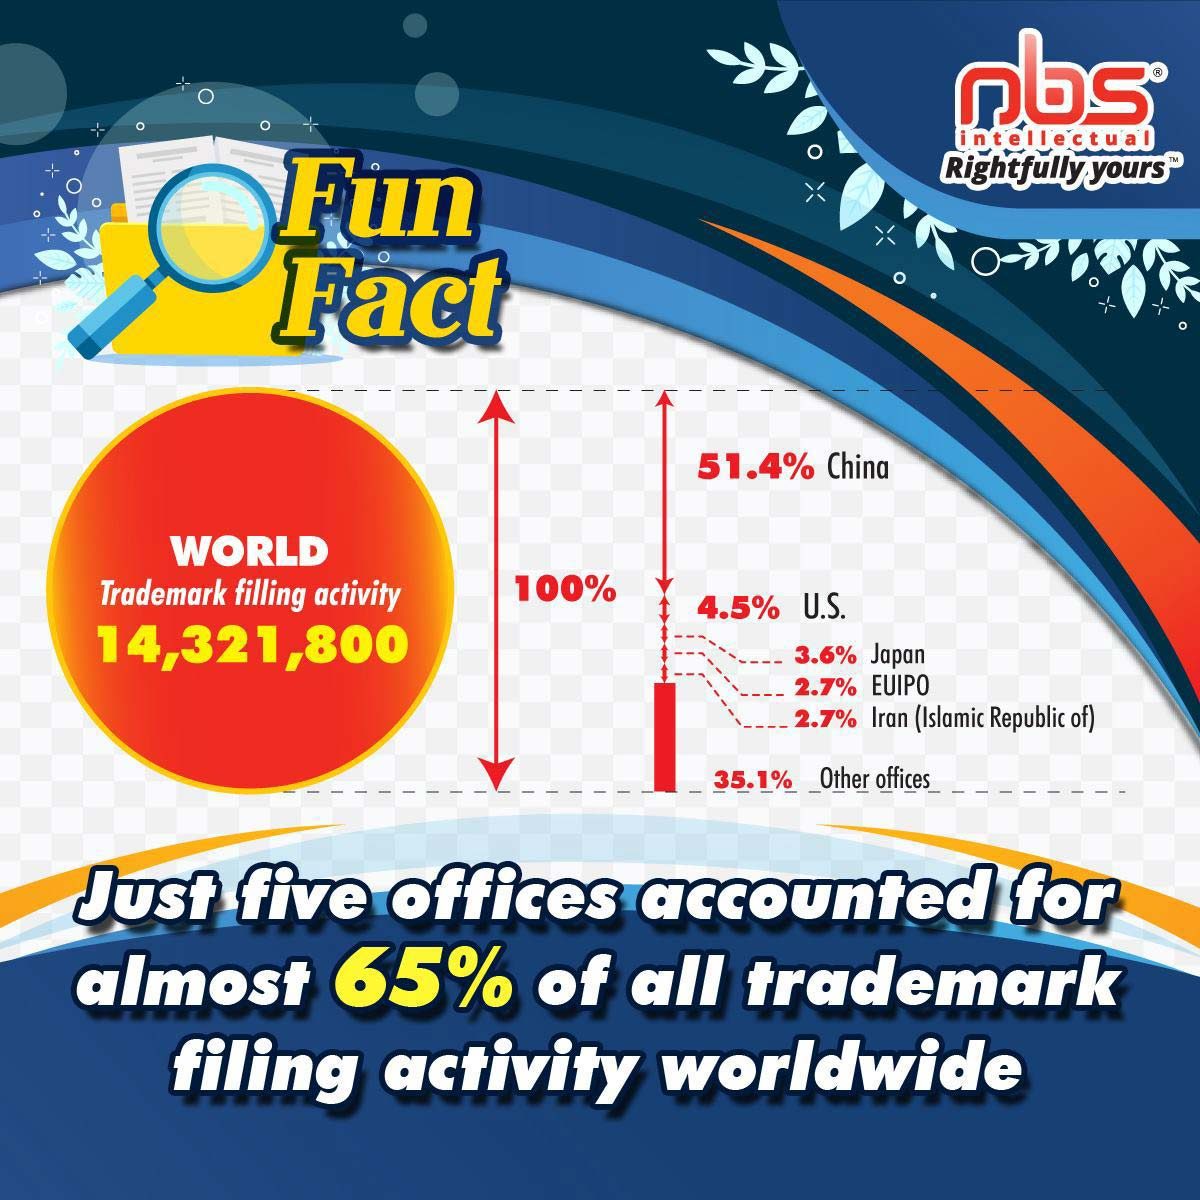
In 2018, almost 65% of all trademark filing activity – as measured in class counts – occurred at the top five offices. Increasing its share of the worldwide total, the office of China (51.4%) now accounts for more than half of all global trademark filing activity, primarily from Chinese residents
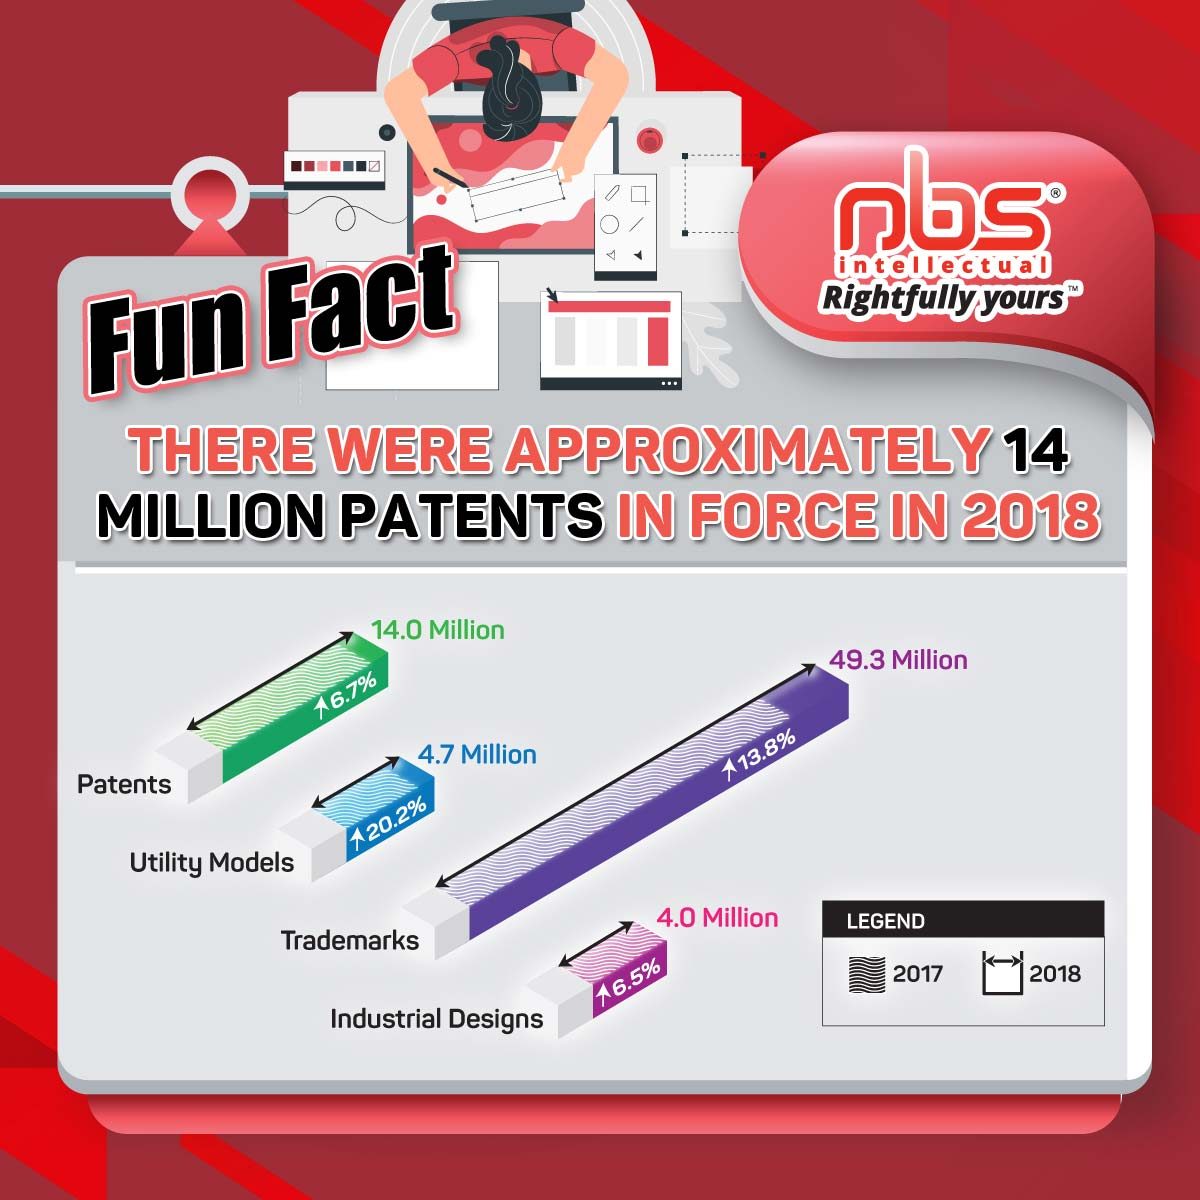
There were around 14 million patents in force worldwide in 2018. The largest numbers in force were recorded in the United States of America (U.S.) (3.1 million), China (2.4 million) and Japan (2.1 million). Of the 49.3 million trademark registrations active worldwide, the greatest number in force